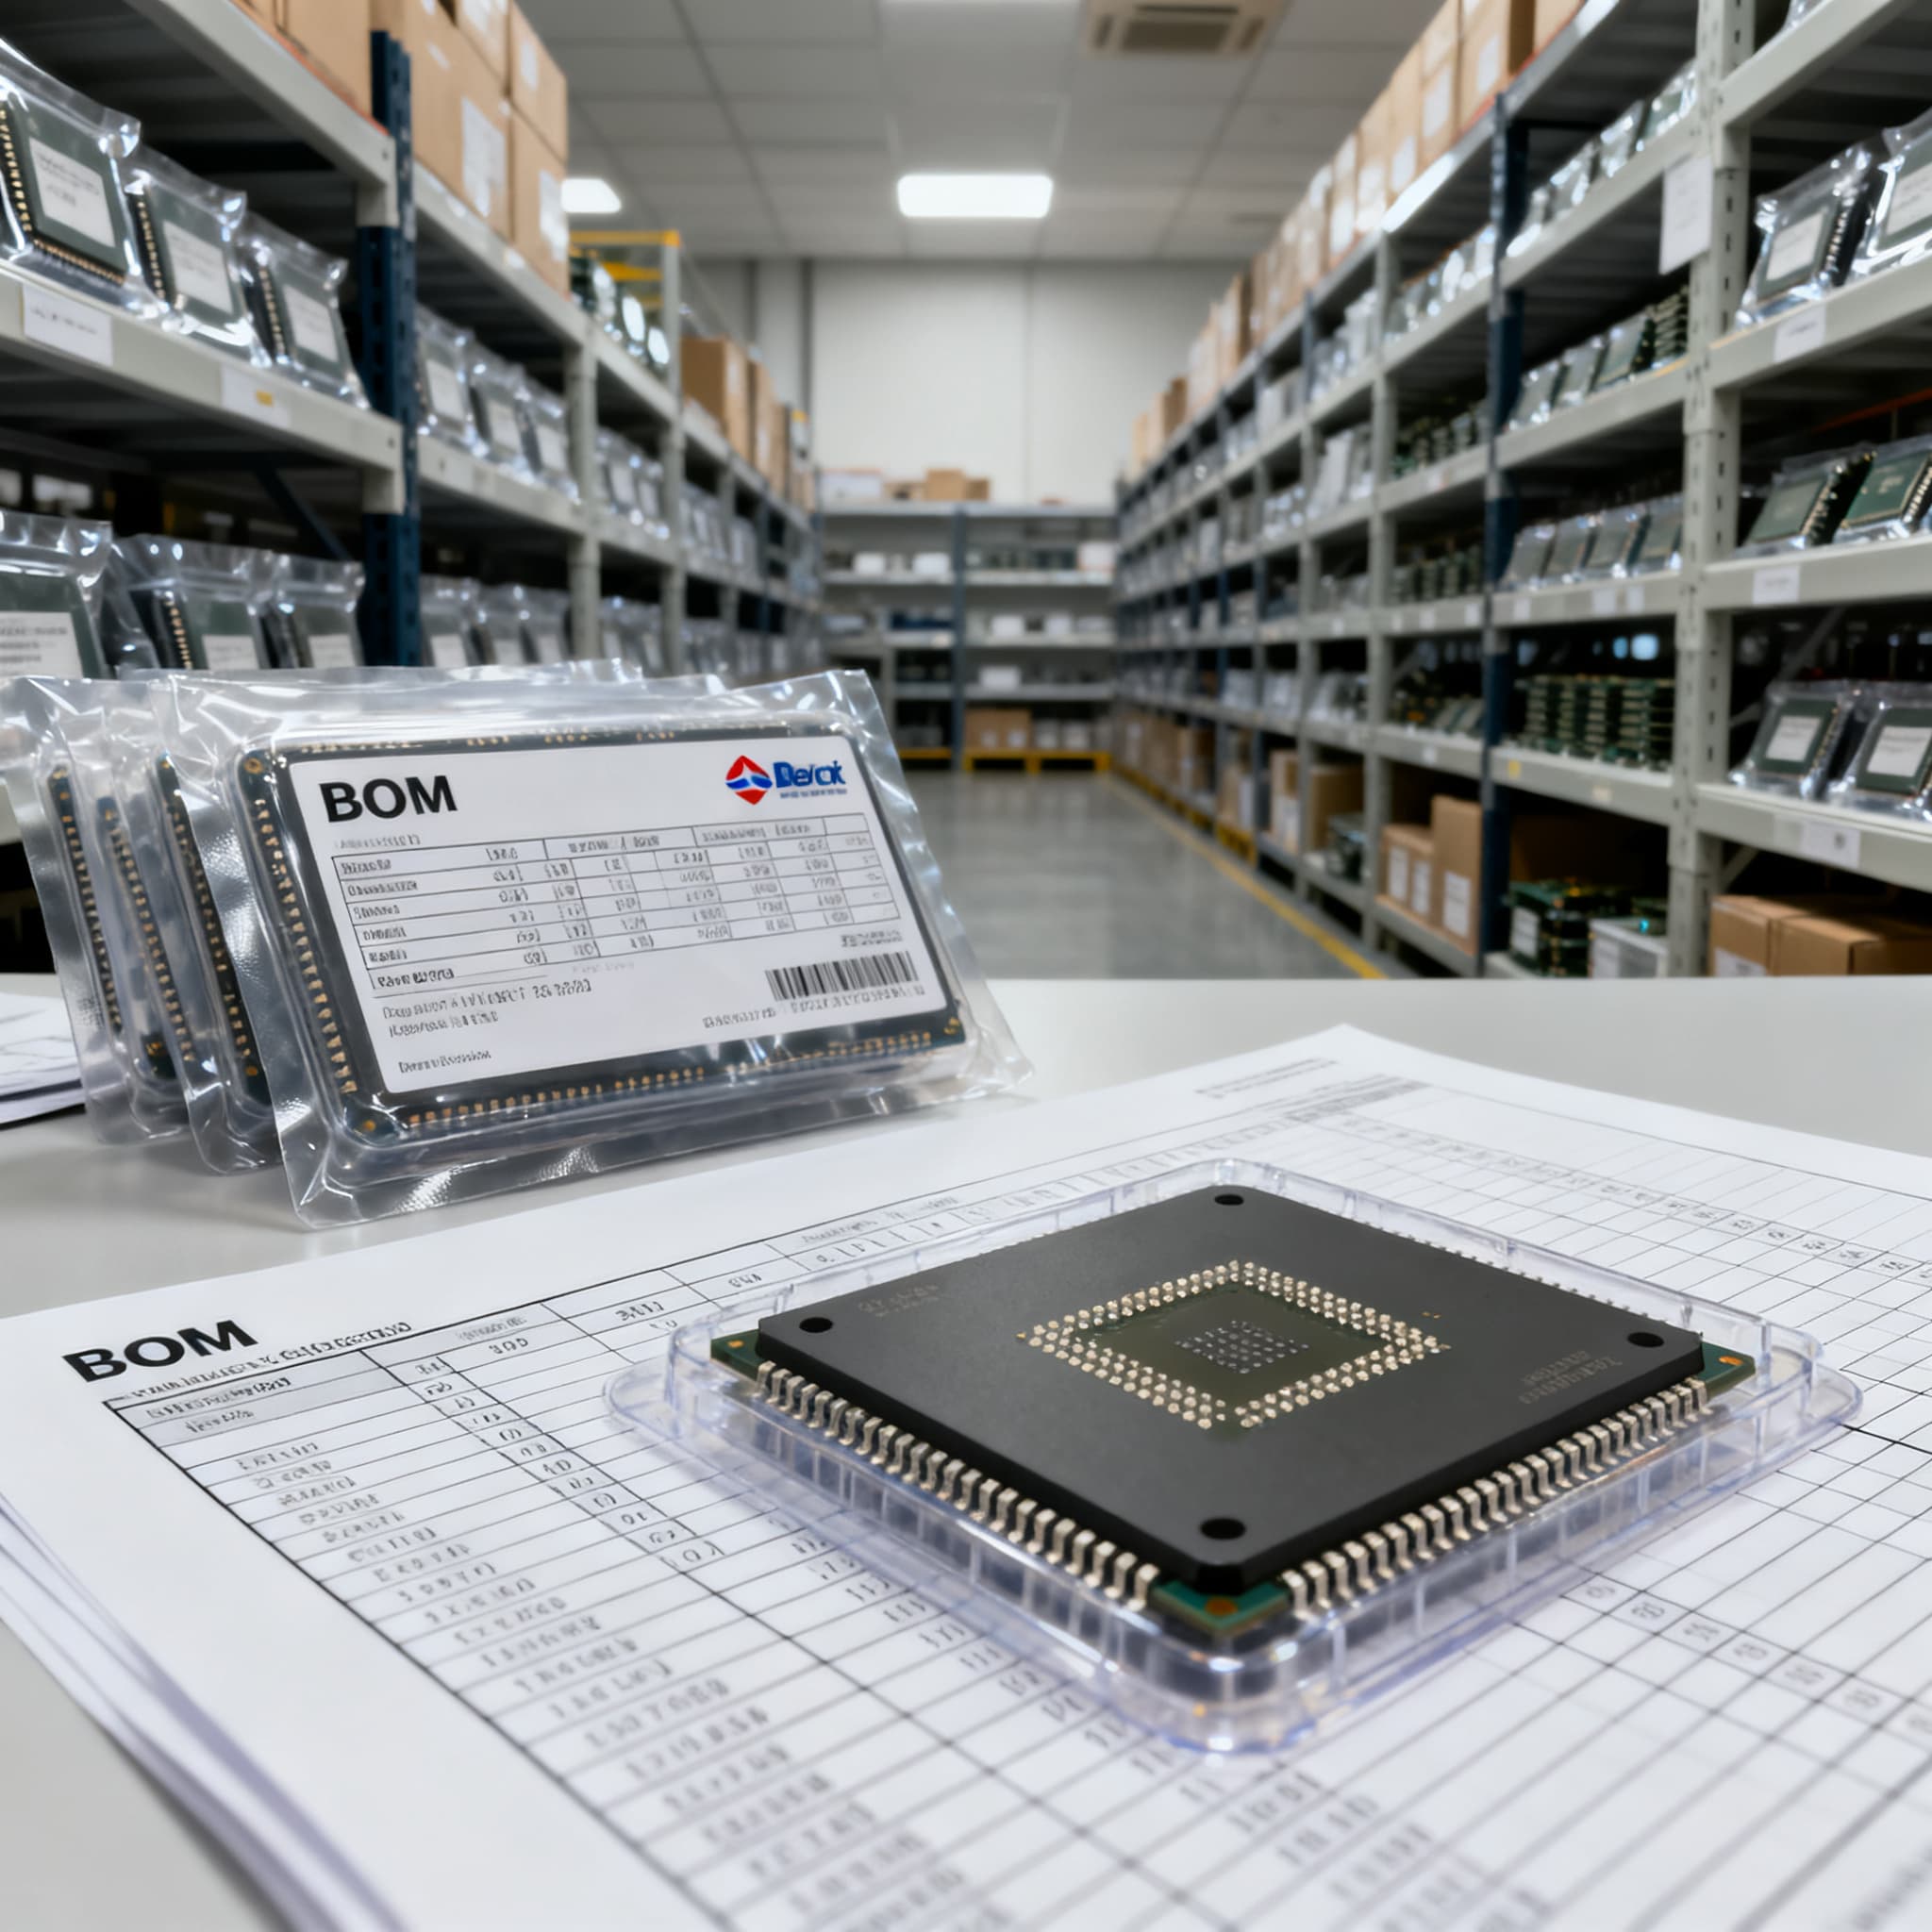
How to Reduce BOM Procurement Cost for Electronics Manufacturers
BOM cost optimization and supplier consolidation strategies that balance savings with risk.
How to Slash BOM Procurement Costs: A Practical Guide for Electronics Manufacturers
Why BOM Procurement Costs Are Spiraling — and What It Means for Your Production Lines
Procurement teams across the electronics industry are facing a perfect storm. Component shortages, tariff volatility, and fragmented supply bases have made bill-of-materials (BOM) costs less predictable than ever. The 2026 Electronic Component Shortage Update from IC Online underscores the urgency: buyers are now forced to identify the top 20% of single‑sourced BOM line items and map out drop‑in replacements or minor layout changes just to keep production running. Meanwhile, Rebound Electronics reports that data and forecasting play a critical role in reducing BOM risk by identifying sourcing vulnerabilities before they impact production. The threat isn’t only availability—it’s hidden cost. Silkbridge warns that any change intended to lower material cost must be evaluated against first‑pass yield, defects, rework, and test failures; a “cheaper” part that degrades quality can erase every cent of savings.
When you’re managing a multi‑line BOM for an OEM or EMS operation, the cost conversation can’t stop at unit price. It must encompass the entire landed cost, supply continuity, and the risk of line‑down situations. The following table captures the macro drivers that are pushing BOM procurement costs higher and what they mean for your bottom line.
| Driver | Mechanism | Procurement Impact |
|---|---|---|
| Global component shortages & allocation | Fab capacity constraints, raw material scarcity, and sudden demand spikes force manufacturers to allocate supply. | Buyers rush to secure any stock, often paying premium prices on the open market. Single-sourced items become line‑stop risks. |
| Tariff and trade policy shifts | New or escalated tariffs on semiconductors, PCBs, and raw materials alter total landed cost overnight. | Procurement must re‑calculate true cost per line item, frequently absorbing 5–15% cost increases that were not budgeted. |
| Single‑sourced BOM items | Designs locked to one manufacturer or one package style leave no alternatives when supply tightens. | Negotiation leverage evaporates; any disruption forces costly redesign or line stoppage. IC Online’s top‑20% exercise highlights the danger. |
| Lack of lifecycle visibility | Manufacturers issue NRND (Not Recommended for New Design) or EOL notices without broad warning. Buyers without real‑time data miss the window. | Last‑time buys drive up inventory carrying costs; later, obsolete parts require expensive spot‑market purchases or re‑qualification. |
| Freight and logistics cost volatility | Fuel surcharges, port congestion, and expedited shipping fees add unpredictable overhead. | A “low‑cost” part ordered from a distant supplier can double in landed cost due to freight, eroding margins. |
| Quality‑related rework and scrap | Counterfeit or non‑conforming components slip into the supply chain, especially when chasing low prices outside authorized channels. | A single batch of substandard parts can cause a 3–5% spike in rework hours and scrap, wiping out earlier unit‑price savings. |
The message is clear: you cannot reduce BOM procurement cost by shopping for the lowest sticker price alone. The next section unpacks what a line item truly costs your organization.
The True Cost of a BOM Line Item: Beyond Sticker Price
Ask any experienced procurement manager and they’ll tell you that the purchase price is just the tip of the iceberg. AGS Devices advises adding indirect costs—shipping, tariffs, and procurement overhead—to arrive at a meaningful total landed cost. Silkbridge takes it further: record purchase price, first‑pass yield, defects, rework, test failures, assembly time, and scrap. If a component substitution reduces material cost but increases failure rate or rework, you’ve made a bad trade. Cadence’s PCB BOM management resource reinforces the need for real‑time pricing and inventory visibility to build a reliable cost baseline.
To illustrate, consider a typical power MOSFET line item—something like an IRFZ44NPBF. The sticker price might be $0.45 in volume. But when you layer in the hidden costs, the total cost of ownership (TCO) can be two to three times that figure. The table below breaks down the cost components for a representative MOSFET, showing why procurement teams must evaluate the full picture.
| Cost Category | Description | Example for a MOSFET (e.g., IRFZ44NPBF) | Procurement Note |
|---|---|---|---|
| Unit purchase price | Negotiated volume price from supplier or distributor | $0.45 ea. at 10k pcs | Often the only number discussed; easily benchmarked via Suntsu’s benchmarking. |
| Ocean/air freight & insurance | Shipping from manufacturer to your facility | $0.04–$0.12 ea. depending on lead time and mode | Expedited shipping can double this; always factor into landed cost. |
| Import duties & tariffs | Customs and trade policy charges | 5–15% of CIF value, adding $0.03–$0.09 | Tariff changes can hit overnight; monitor trade policy updates. |
| Procurement overhead | Buyer time, supplier qualification, PO processing | $0.02–$0.05 ea. when amortized over volume | Consolidating fewer suppliers reduces this cost. |
| Incoming inspection | Visual checks, electrical testing, packaging verification | $0.01–$0.03 ea. for standard MOSFETs | Higher if you must perform detailed parametric testing due to sourcing risk. |
| Rework & scrap | Cost of failures discovered during assembly or test | If failure rate rises from 0.1% to 0.5%, scrap cost jumps from $0.0005 to $0.0025 plus rework labor | Silkbridge’s metrics are essential here; even a small yield change matters. |
| Inventory carrying cost | Capital tied up in safety stock, warehousing, obsolescence risk | $0.01–$0.02 ea. per month | Particularly relevant when you stockpile a part that goes EOL. |
The takeaway is straightforward: chasing a 10‑cent reduction on the unit price is meaningless if landed cost rises by 20 cents or your assembly line yield drops. In the next section, we compare the most effective levers for lowering total BOM procurement cost—without sacrificing quality or supply continuity.
Cost-Reduction Levers Side by Side: Value Engineering, Multi-Sourcing, and Data-Driven Buying
Seasoned procurement teams use a mix of four distinct strategies to cut BOM costs sustainably. Suntsu Electronics demonstrates that a well‑executed BOM analysis combines component value engineering, benchmarking, and negotiation. Perceptive Electronic Components shows that even when the unit price of an integrated IC is higher, the total BOM cost drops because the component count and PCB complexity shrink. AGS Devices highlights the value of replacing a custom connector with a pin‑compatible standard version, while Silkbridge insists on prioritizing critical items with long lead times, limited manufacturing sites, or unstable lifecycles. Rebound’s predictive intelligence and Avnan’s EMS‑driven value engineering round out the picture. The table below compares these four levers so you can decide where to apply your efforts first.
| Action | When to Use | Typical Savings Range * | Trade‑off & Risk |
|---|---|---|---|
| Value Engineering (design‑level) — replace high‑cost ICs, combine functions, reduce layers | During NPI, redesign, or when a single part drives >20% of BOM cost | 5–15% of total BOM cost (can reach 20% when combined with part‑count reduction) | Requires engineering bandwidth and re‑qualification; changes may affect firmware or EMI. Always verify with pilot builds. |
| Standardization & Approved Alternates — swap custom connectors, magnetics, or discretes with multi‑sourced standard parts | When sole‑sourced, non‑standard parts are flagged as high‑risk (e.g., IC Online’s top‑20% list) | 3–10% of component cost, plus tooling and lead‑time reduction | May need minor PCB layout tweaks; ensure pin‑compatibility and equivalent parasitics. Cross‑reference with Perceptive’s cross‑reference tools. |
| Multi‑Sourcing & Risk Mitigation — qualify second sources for critical items; build supply chain resilience | When a part has long lead times, limited fabs, or unstable lifecycle status (Silkbridge’s risk framework) | 3–8% negotiation leverage; avoids costly line‑downs that can cost orders of magnitude more | Requires upfront qualification effort; not all parts have true drop‑in alternatives. Perform sample testing and monitor first‑pass yield. |
| Predictive Procurement & Data‑Driven Negotiation — use real‑time market intelligence, pricing history, and lead‑time forecasts to time buys and negotiate | For all BOM items, but especially high‑spend, volatile lines | 5–10% on unit price through timing and volume aggregation; additional savings from avoiding premium open‑market buys | Data quality is critical; outdated or incomplete intelligence can lead to mistimed purchases. Partner with sources that aggregate live distributor data. |
* Savings ranges are indicative and based on industry experience; actual results depend on volumes, market conditions, and execution rigor.
None of these levers works in isolation. The most successful teams layer value engineering with multi‑sourcing and then use predictive data to time their negotiations. The next section walks you through a practical, four‑step playbook that combines these approaches into a repeatable process.
A Step-by-Step Playbook for Lowering Procurement Spend Without Adding Risk
Reducing BOM procurement cost demands a structured approach that engages engineering, quality, and supply chain stakeholders. The following four steps, drawn from the strategies and data sources referenced above, have been proven in EMS and OEM environments.
- Step 1 – Audit the BOM and Flag the Critical 20%. Start with the IC Online tactic: work with engineering to identify the top 20% of BOM line items that are single‑sourced, have long lead times, or account for the highest spend. For each, map potential drop‑in candidates or minor layout changes. This exercise alone often reveals 15–20 quick‑win opportunities.
- Step 2 – Calculate the True Landed Cost and Set a Baseline. For every flagged item, compute the total cost of ownership using the categories from Table 2. Incorporate AGS Devices’ indirect costs (shipping, tariffs, overhead) and Silkbridge’s quality metrics (first‑pass yield, rework, scrap). Use Cadence’s pricing and inventory history to verify that your baseline unit prices are competitive. This step ensures you are comparing apples to apples when evaluating alternatives.
- Step 3 – Evaluate Alternatives with a Cross‑Functional Team. Leverage Perceptive’s cross‑reference tools and Suntsu’s value engineering methodology to find pin‑compatible standard parts, integrated ICs that combine multiple functions, or second‑source options. Engage Avnan’s EMS‑driven simplification approach to reduce part count. For each candidate, require a sample, a side‑by‑side spec comparison, and a small pilot build. Monitor Silkbridge’s quality checkpoints (first‑pass yield, defects, rework) and only approve the change if the total landed cost drops without degrading reliability.
- Step 4 – Negotiate with Data and Monitor Continuously. Armed with benchmarking data from Suntsu and real‑time market intelligence from Rebound, enter negotiations with clear price targets and volume aggregation plans. Use Cadence’s inventory and pricing history to avoid overpaying during allocation windows. After implementation, schedule quarterly BOM health checks to re‑evaluate the top‑20% list, track component lifecycle changes, and adjust sourcing strategies as the market evolves.
Tip: Do not attempt to implement all changes at once. Start with the 5–10 items that combine high spend, single‑source risk, and a clear alternative path. Build organizational confidence, then scale the process.
Questions Procurement Leads Ask About BOM Cost Reduction
Here are the most common questions we hear from senior procurement managers and supply‑chain leads—answered with the practical context you need to act.
- Q: What’s the single biggest mistake procurement teams make when trying to cut BOM costs?
-
Focusing solely on unit price without accounting for indirect costs like shipping, tariffs, and rework. As AGS Devices and Silkbridge highlight, a lower‑priced part that increases defects or test time can wipe out any savings. Always calculate total landed cost and monitor first‑pass yield after a change.
- Q: How do we convince engineering to accept alternate components without re‑qualification headaches?
-
Start with pin‑compatible standard versions and present a cross‑reference analysis that includes electrical specs, footprint, and reliability data. Show engineering the cost delta and the risk of sole‑sourcing—IC Online’s top‑20% exercise is a powerful visual. Use small‑scale pilot builds with Silkbridge’s quality metrics to build confidence.
- Q: Can we really reduce BOM cost by 10–20% just by negotiating, or is design change mandatory?
-
Negotiation alone can yield 5–10% on high‑volume lines, but double‑digit savings typically require a mix of value engineering, multi‑sourcing, and lifecycle management. Suntsu’s benchmarking data shows that combining negotiation with component value engineering and standard‑part substitution routinely hits 15–20% reduction without sacrificing quality.
- Q: Which BOM line items should we target first for the fastest cost savings?
-
Prioritize single‑sourced, high‑cost, and long‑lead‑time items that can stop the line. Silkbridge’s risk framework and IC Online’s 20% rule are your guide. Also look for custom connectors, magnetics, and mechanical parts that can be swapped for standard equivalents (as AGS Devices suggests).
- Q: How do we balance cost reduction with the risk of counterfeit parts or quality issues?
-
All alternates must go through a formal qualification process: require sample testing, review first‑pass yield, and monitor rework rates. Stick to approved‑source lists and use certified distributors. Rebound’s predictive data can flag lifecycle changes that make a component more susceptible to gray‑market risk.
- Q: What role does supply chain data play in sustaining long‑term BOM cost reductions?
-
Data is the backbone of proactive procurement. Real‑time pricing, inventory levels, and lead‑time forecasts (Cadence, Rebound) let you buy at the right time and volume. Historical cost data and benchmarking (Suntsu) empower you to negotiate aggressively and spot drifts before they erode margins.
Slashing BOM procurement costs isn’t a one‑time project—it’s a discipline that combines engineering collaboration, rigorous cost modeling, and data‑driven sourcing. By applying the levers and playbook outlined here, electronics manufacturers can drive double‑digit savings while protecting supply continuity and product quality. When you’re ready to turn your BOM analysis into actionable quotes, consolidate your sourcing through a single partner that can handle multi‑line procurement with the transparency you need. Upload Your BOM for a consolidated quote, or Request a Quote for a single MPN and let our team help you unlock the savings hidden in your BOM.
References & Further Reading
- 2026 Electronic Component Shortage Update for Buyers — IC Online
- How to Reduce Electronics BOM Cost Without Increasing Supply or Quality Risk — Silkbridge
- BOM Cost in 2025 [Calculations + How To Reduce It] — AGS Devices
- Reducing BOM risk in electronics manufacturing — Rebound Electronics
- BOM Analysis & Cost Reduction — Suntsu Electronics
- How to Reduce BOM Cost in Electronic Design and Component Sourcing — Perceptive Electronic Components
- Building a Better BOM – EMS Strategies to Reduce Costs and Lead Times — Avnan
- PCB BOM Management for Engineers and Designers — Cadence