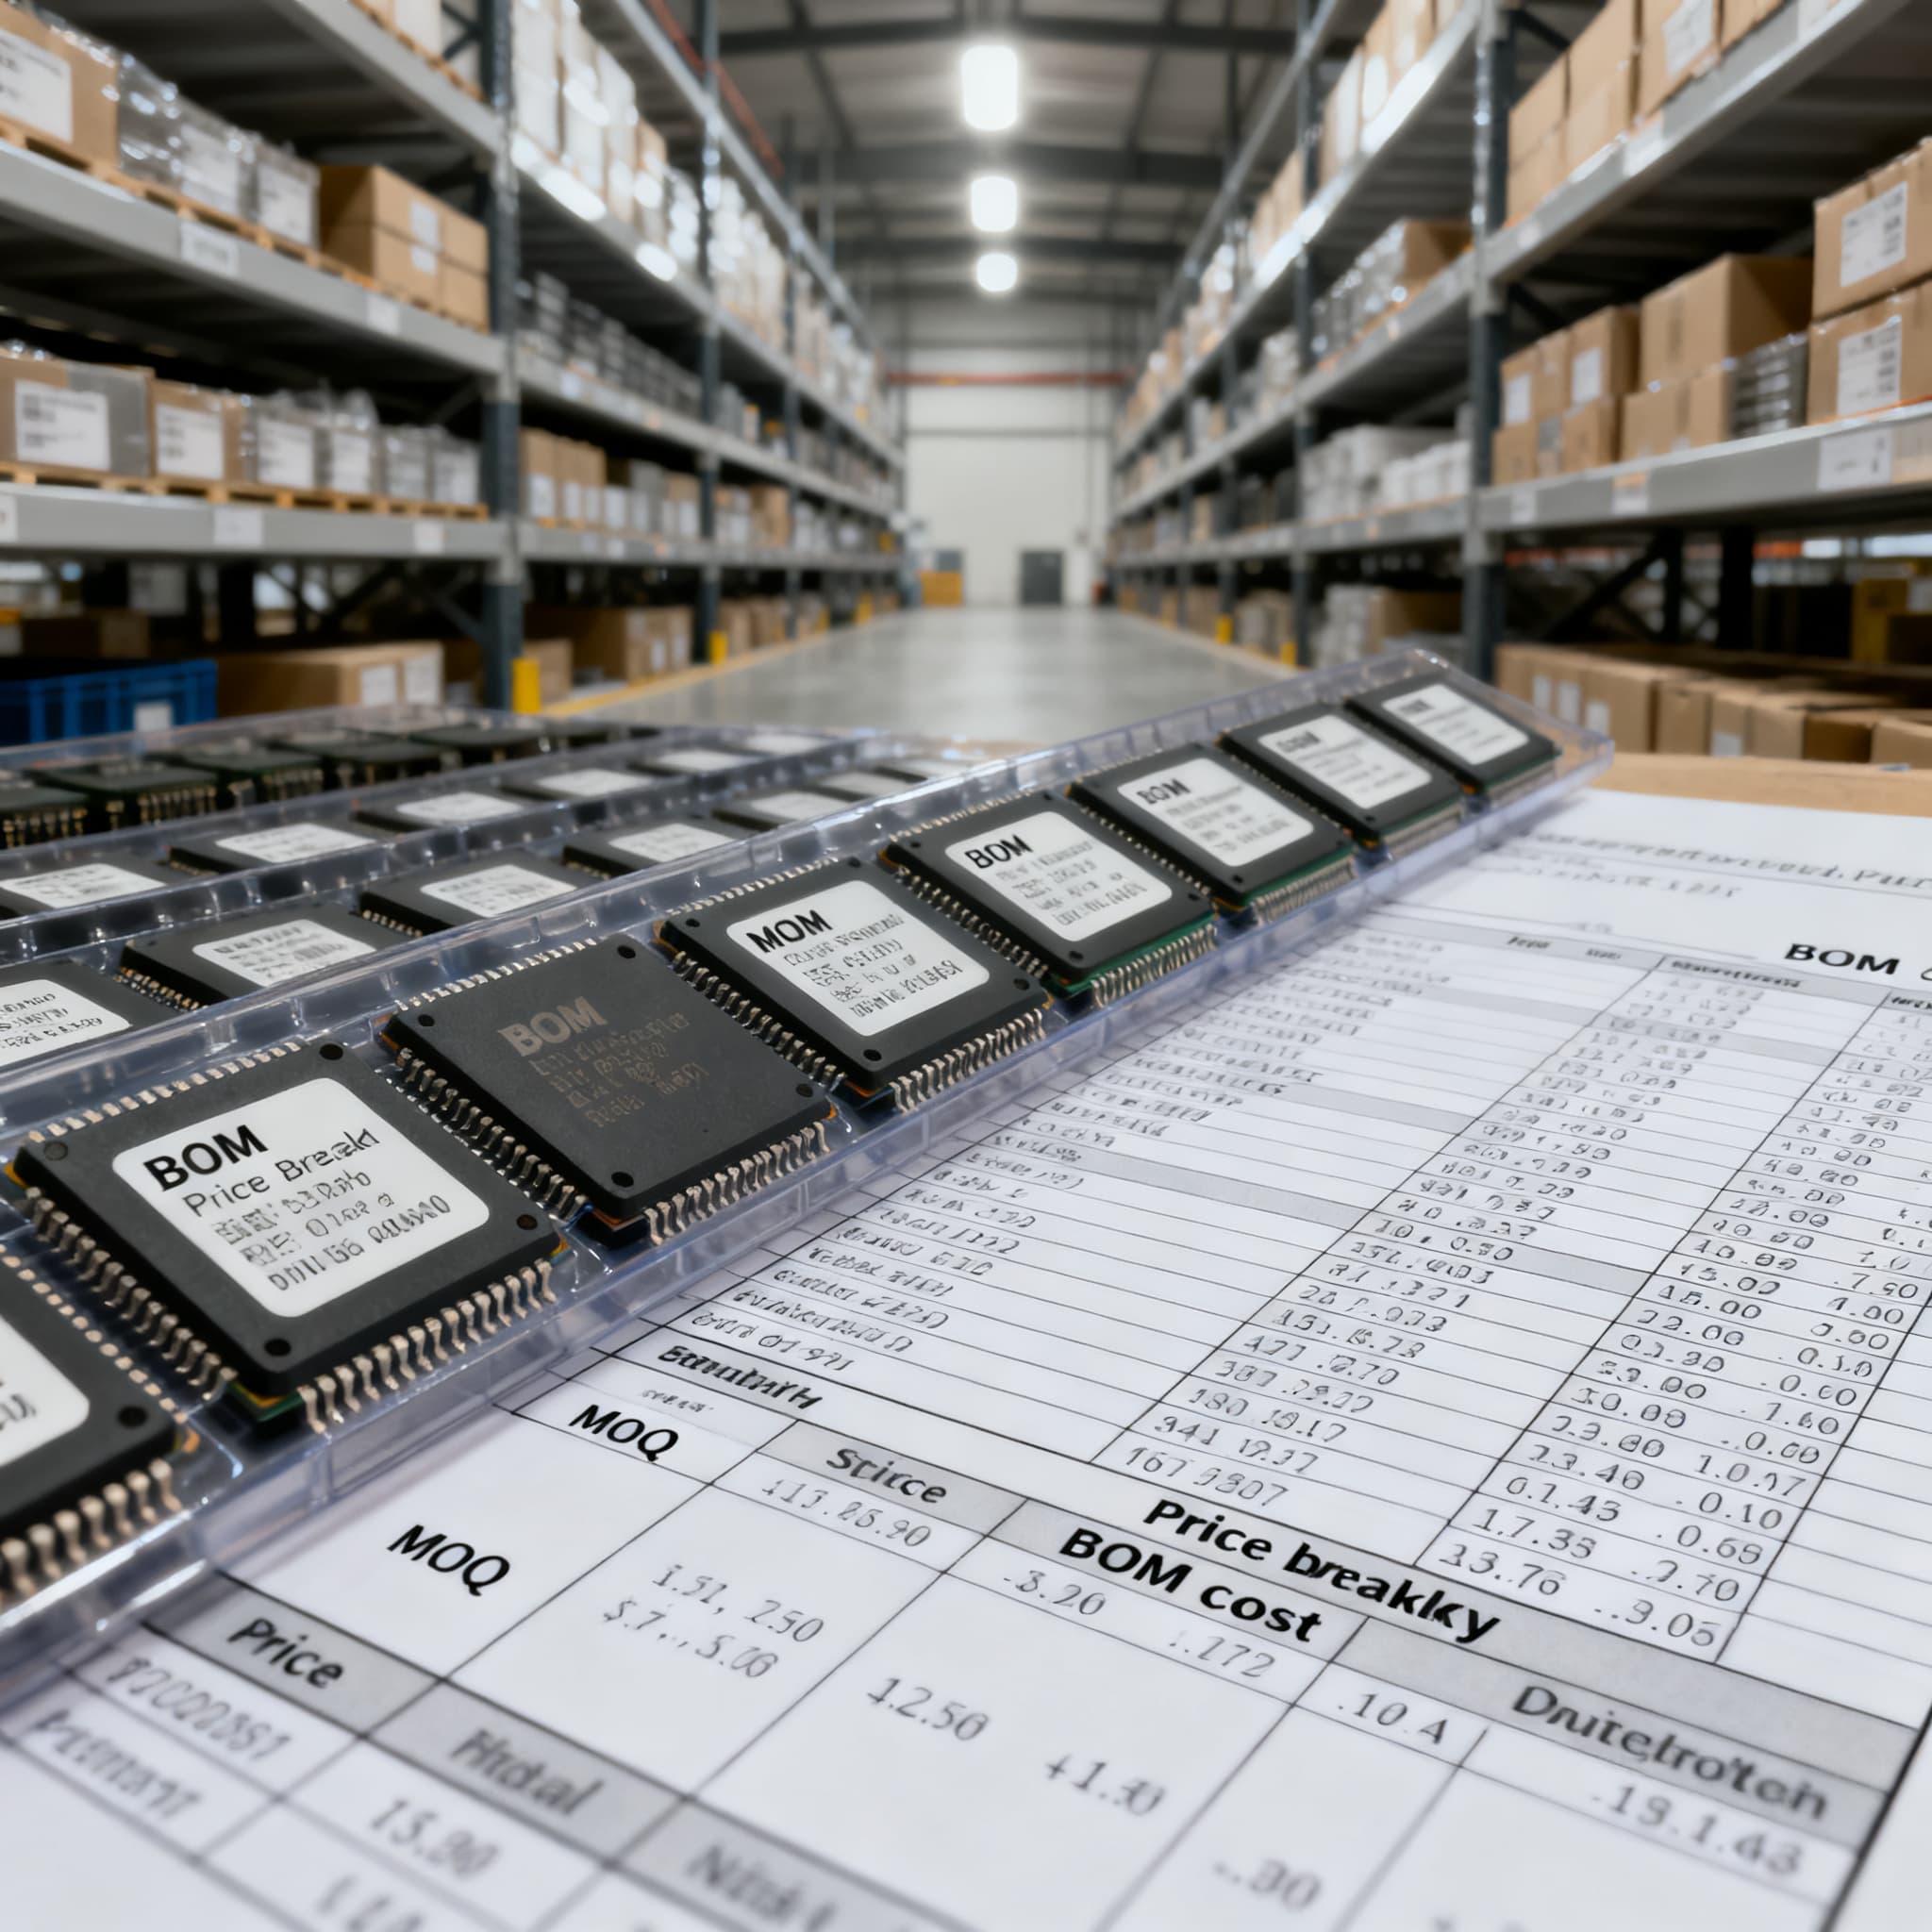
MOQ and price-break checks that change BOM cost
BOM cost optimization and supplier consolidation strategies that balance savings with risk.
Why That 'Unit Price' BOM Estimate Is Bleeding Your Margin Before You Buy
You finalised the design with a materials cost of $32.80. Then the first batch of supplier quotes arrives. A connector you planned to buy at $0.34 each in 200‑piece quantities now requires a full 2,500‑piece reel, and the inductor you specified for the DC‑DC stage jumps from $0.22 to $0.48 when you break below the 1,000‑unit price‑break threshold. Within an hour, your landed BOM cost has climbed 18% — not because the component prices changed, but because nobody checked the real‑world minimum order quantities and price‑break tiers before the BOM was costed.
This scenario repeats itself across every sector of electronics manufacturing. A case study from Findchips illustrates how a part selected by design solely on electrical fit can saddle a programme with a 3,000‑piece MOQ that destroys the business case for a 500‑board pilot build. Meanwhile, mock‑drill failures on material declaration drift expose how uncontrolled BOM revisions widen the gap between what was budgeted and what actually gets purchased. When critical purchasing information — MOQ, price breaks, packaging multiples — is simply missing from the product‑table data that buyers rely on, they cannot make confident part choices, as Baymard research confirms. The cumulative effect is a “costed BOM” that can drift 15–30% from the “quoted BOM” and, eventually, from the “purchased BOM,” erasing margin before a single board is assembled.
Key Takeaway: The unit‑price BOM that engineering signs off on is not the same as the landed‑cost BOM that procurement can actually buy. The gap is rarely a single line item; it’s the sum of MOQ excess, hidden packaging multiples, and price‑break thresholds that were never flagged during costing.
| Driver | Mechanism | Procurement Impact |
|---|---|---|
| Packaging‑multiple MOQ (reel/tray) | A 4,000‑piece reel becomes the effective MOQ even if line‑item demand is 800 pieces; the supplier will not break a sealed reel without a surcharge. | Forces an overbuy that loads excess inventory cost onto the programme, distorting per‑board cost and tying up cash. |
| Tiered price breaks not mapped to build volume | The BOM cost model uses 1ku unit price, but the real purchase happens at a 100‑piece price point 3× higher because the project volume cannot hit the 1ku tier. | Gross margin projection at NPI stage is fiction; first production run already consumes the buffer. |
| Missing price‑break data in supplier portals | Buyers cannot see that the $0.07 price exists only above 5,000 pieces; they assume linear scaling and budget accordingly. | Purchase price variance (PPV) appears the moment the PO is placed, and the supply‑chain team is held accountable for a costing error. |
| Single‑source part with high supplier MOQ | Design selects a proprietary IC or a specific package variant that only one distributor stocks in full reels; no alternates are logged. | Negotiation leverage collapses; the buyer must accept the MOQ or delay the build, and redesign cost is rarely in the NRE budget. |
| BOM revision drift without re‑costing | An ECO swaps a resistor array for an equivalent part but changes the package to one that ships in trays of 160 instead of reels of 5,000, affecting usable quantity and attrition. | Plant receives a kit that needs 20 trays for 3,000 placements, increasing feeder occupancy, loading time, and line‑stop risk, while scrap from tray‑induced dropped parts inflates the effective unit cost. |
| Landed‑cost burying MOQ in freight and fees | A supplier offers a lower unit price at a 2,000‑piece quantity but ships from an overseas hub with DDP terms; the freight uplift outpaces the unit price savings. | The buyer sees only the ex‑works price break and misses the total cost‑of‑goods‑sold impact until the customs invoice arrives. |
Every one of these drivers shows up in the space between a costed BOM and a purchased BOM — a space that many organisations only notice when the quarterly PPV report is already red. The fix starts with treating MOQ and price‑break verification as a discrete step in the BOM‑costing workflow, not an afterthought.
The MOQ‑Price Break Multiplier: How Quantity Tiers Flip Component Economics
Price‑break curves in electronics are rarely linear. A common passive — say a 10 µF MLCC in 0805 — might sit at $0.12/unit for 100 pieces, drop to $0.06/unit at 2,500 pieces, and reach $0.035/unit at a full 10,000‑piece reel. The trap, however, is that the 2,500‑piece price point is not available as a cut‑tape; the supplier sells the part in full‑reel multiples of 3,000. To access the $0.06 price, you commit to 3,000 pieces, not the 1,200 your build actually needs. The usable volume after attrition and panelisation is even lower — a 3,000‑piece reel may deliver only 2,850 placements after feeder‑calibration scrap and placement rejects. Your “unit cost” of $0.06 therefore applies to 3,000 pieces, but you can only amortise that cost across 1,200 consumed parts; the effective cost per consumed part jumps to $0.15, wiping out the price‑break advantage.
This is the MOQ‑price break multiplier at work. Packaging configuration — tape‑and‑reel, tray, tube — acts as a hard floor that overrides the tiered pricing table. An EMS quoting only on the line‑item unit price will under‑represent the true landed cost. PCB MOQ discussions reveal the same pattern: the MOQ may be expressed in pieces, panels, or minimum value — and the difference determines whether you pay for excess area that becomes scrap. In component procurement, the same logic applies: you need to ask whether the MOQ is by pieces, by complete reels, or by minimum order value, and then trace the cost against the usable quantity.
BOM cost drift analysis suggests that MOQ excess deserves its own line in the variance breakdown, separate from substitution, FX, attrition, and landed‑cost changes. When you isolate MOQ‑induced overbuy as a category, two things happen: engineering sees the cost of a packaging‑informed component choice, and procurement can negotiate with data instead of blame.
Tip: Before you accept a unit‑cost price break, work the equation backwards: (MOQ × unit price + freight + handling) ÷ usable quantity. Only then compare it against alternates with lower packaging multiples — you may find that a $0.09 unit price on a 500‑piece cut‑tape is cheaper in total than a $0.06 reel‑locked price for your 1,200‑piece demand.
| Strategic Option | Effect | Notes |
|---|---|---|
| Absorb excess inventory on a high‑runner | Overbuy becomes future demand; write‑down is avoided because the part will be consumed within the shelf‑life. | Works when the part is standard, multi‑program, and the excess quantity aligns with confirmed 12‑month forecast. Risk: forecast slippage turns working capital into dead stock. |
| Aggregate demand across company programmes | Combined volume hits a higher price‑break tier and allows a single full‑reel purchase that is split across divisions. | Requires a centralised BOM analysis tool or a partner who can consolidate and kit per programme. Adds logistics cost but dramatically lowers unit price. |
| Pay a partial‑reel surcharge on sole‑source ICs | Distributor breaks a reel for a 10–20% upcharge; you get exact quantity without the overbuy burden. | Negotiable when you present a credible forecast; some franchised distributors will hold consignment stock if they see recurring demand. |
| Redesign to a lower‑MOQ alternate with standard packaging | Engineering qualifies a drop‑in or near‑equivalent part available in cut‑tape or smaller reels; sourcing risk falls to the cost of requalification. | Best for niche, low‑run designs where the MOQ overbuy recurs every build. Design review must include procurement before ECO freeze. |
| Supplier‑managed consignment or VMI | Vendor holds stock and invoices on pull; you avoid the upfront MOQ cash outlay. | Suited to larger annual volumes. Requires contractual commitment and accurate pull‑through forecasts; otherwise supplier pulls the line. |
None of these options is free, but comparing them with the blind absorption of an unchecked MOQ reveals the real cost of inaction. A BOM‑costing process that surfaces these trade‑offs before the RFQ stage turns the MOQ‑price break multiplier from a margin killer into a manageable variable.
BOM Costing Approaches: Spreadsheet Guesswork vs. Quote‑Backed Checks
Not all BOM‑costing workflows expose MOQ and price‑break risk equally. The differences become visible when you cross‑check the same BOM across three common approaches.
Approach 1: Static unit‑price BOM. Engineering pulls prices from a distributor’s website or a previous bill, copies the 1ku column into the spreadsheet, and multiplies by projected volume. Price‑break tiers, packaging multiples, and supplier‑specific MOQ are absent. This method is fast and gives the illusion of precision, but it fails the moment the purchase quantity lands in a different price column. ImportMetric’s supplier quote comparison guide underscores that a price comparison is meaningless when the specifications — including packaging and quantity constraints — differ.
Approach 2: Manual supplier quote comparison. Procurement sends the BOM to three distributors or EMS partners and compiles the responses. Buyers separate planned order quantity from MOQ and price‑break thresholds, but they often miss packaging constraints because the RFQ did not ask for reel/tray multiples. The quote may show a unit price that assumes a full reel, yet the BOM line item says 500 pieces. Without a structured method, a buyer can unintentionally accept a price that carries an unmapped MOQ liability. EMS pricing curves reveal visible break points at 100, 500, 1,000 and 5,000 pieces — requesting at least two of these tiers on every BOM line surfaces the real elasticity and highlights where the MOQ monster hides.
Approach 3: Quote‑backed costing with alternates and tier visibility. In a structured environment, the BOM is costed against live availability, packaging breaks, and engineer‑approved alternates. Each line item shows price at two volume tiers, the packaging multiple, and the functional unit cost after attrition. Alternates are tagged — “safe” for qualified drop‑ins, “conditional” for parametric fits that need test validation, “last resort” for end‑of‑life stock — so procurement can re‑route around high‑MOQ lines before the RFQ even goes out. Industry guidance on product costing in electronics manufacturing advocates capturing alternates per BOM line with clear ownership of who approved them, then applying MOQ, price breaks, and lead time constraints per supplier to the model.
| Comparison Metric | Static Spreadsheet (Approach 1) | Supplier Quote Comparison (Approach 2) | Quote‑Backed Environment (Approach 3) |
|---|---|---|---|
| Price‑break visibility | None — single unit price per line | Partial — dependent on supplier’s quote details | Full — at least two tiers modelled, linked to packaging multiples |
| MOQ awareness | Absent | Shown if supplier discloses; often omitted when quoting “ex‑stock” | Explicit — MOQ per line, by pieces/reels/value, surfaced before RFQ |
| Packaging constraint handling | Not considered | Buyer must manually verify; easy to overlook on multi‑page quotes | Automated flag when order qty < packaging multiple |
| Alternate evaluation | Rarely included; design is frozen | Reactive — only if MOQ becomes an issue | Proactive — cleared alternates with tiered pricing listed per line |
| Landed cost accuracy | Low; ignores freight and attrition | Moderate; may miss out‑of‑scope charges | High; amortised over usable quantity and inclusive of logistics |
| Engineering–procurement alignment | Separate silos | Loosely coupled; discussion after quotes land | Tightly coupled; design reviews include procurement‑verified cost data |
The comparison table makes one thing clear: when you rely on a static spreadsheet, you are costing a theoretical BOM. Approach 2 improves on it but still leaves packaging‑multiple surprises on the table. Approach 3 turns the BOM into a procurement‑ready instrument — and that is what separates programmes that meet their target cost from those that are surprised at PO booking.
Note: Asking an EMS partner to quote at two of the known break‑points (e.g., 100‑board and 1,000‑board volumes on the same BOM) is a quick, low‑effort way to inject real pricing elasticity into your cost model. You will quickly spot which lines push the total cost up disproportionately when volumes drop — those are your MOQ‑sensitive components.
Five Checks to Close the MOQ‑Price Break Gap Before PO Release
These five actions are designed to be implemented immediately in your next BOM‑costing cycle. They do not require a new ERP system — just a disciplined RFQ process and a willingness to bridge design and procurement data early.
- Pull live availability and packaging breaks alongside unit price. Do not accept a BOM cost model built on static price lists. For every line item, check the minimum order quantity, the packaging multiple (reel size, tray count, tube length), and the price tier that matches your actual volume intake. Findchips recommends comparing variants against real stocking depth before committing to one part — this same discipline prevents the MOQ trap.
- Separate planned order quantity from supplier MOQ and price‑break threshold. When you receive a quote, explicitly note the quantity on which the unit price is based. A $0.45 price may be tied to a 1,000‑piece MOQ even though you requested 300 pieces. ImportMetric’s guide advises separating the planned order quantity from the supplier MOQ and any price‑break quantity, so that a price comparison across vendors is done on equivalent footing.
- Ask the EMS partner to quote at least two volume tiers on the same BOM. Request pricing at, for example, 100 and 1,000 sets. The difference reveals true cost elasticity of the design and immediately surfaces components whose MOQ constraints make the smaller build disproportionately expensive. GNS EMS research shows that visible break points exist at 100, 500, 1,000 and 5,000 pieces — quoting across those thresholds gives procurement actionable data.
- Send a clean BOM with manufacturer part numbers and package sizes; negotiate MOQ definition. A BOM that simply says “10 µF 0805” invites assumption. Provide the full MPN and package suffix so the supplier can quote attrition precisely instead of padding it. Then ask explicitly whether the MOQ is by pieces, panels, area, or minimum value. PCBSync’s PCB MOQ guidance — applicable equally to component buys — emphasises that a clean BOM and a two‑ or three‑quantity price-break request let you see where setup cost stops dominating.
- Verify that supplier quotes include essentials such as stencil, test report, and stackup confirmations so that quantity isn’t used to hide unresolved engineering questions. A tempting low MOQ quote may later balloon when you realise the supplier excluded the stencil or assumed a different stackup. QueenEMS points out that a purchase order should stop when quantity is being used to obscure an unapproved material substitution or a drawing discrepancy — the same principle applies to any component quote that seems too good on price alone.
| Action | When to Use | Trade‑off |
|---|---|---|
| Introduce MOQ‑aware BOM costing checklist in the design‑review gate | Before schematic freeze and during first cost roll‑up | Adds 1–2 days to the review cycle; reduces PPV by orders of magnitude on the first production purchase. |
| Cross‑reference packaging multiples against order quantity in RFQ prep | Immediately after receiving engineering BOM, before sending to suppliers | Requires buyer to spend time on each line; time is recovered by eliminating re‑quotes and last‑minute surprise buy‑ins. |
| Aggregate demand across business units to hit a price‑break tier | When component is standard and forecast across divisions is credible | Consolidation logistics add handling cost; avoid if one unit’s forecast is speculative — an inventory bulge from a dropped programme hurts all. |
| Negotiate partial‑reel or consignment terms into the RFQ template | For any part where MOQ exceeds 150% of planned consumption | Supplier may price in a premium; but the premium is always known and can be compared against scrap cost — transparency wins. |
| Require alternate part evaluation with tiered pricing as a design‑review output | For single‑source or high‑MOQ lines flagged in the initial costing | Engineering effort is non‑zero; the payback is a BOM that stays in budget when volumes fluctuate and a qualification that is already done when the primary source tightens. |
Implementing even three of these checks will close the gap between a costed BOM and the real landed cost. The discipline is not about adding paperwork — it’s about giving procurement the visibility to prevent margin erosion that engineering never intended.
Procurement and Engineering FAQ: MOQ, Price Breaks, and BOM Cost Control
Q: How do we calculate true per‑unit cost when MOQ forces an overbuy beyond our production volume?
A: Start with the total landed cost: part cost × MOQ plus freight, tariffs, and any handling charges. Divide that total by the number of units you will actually consume — not the full MOQ quantity. The excess quantity becomes a one‑time inventory holding cost or a scrap provision. Then compare that functional unit cost against alternative parts with packaging that aligns better with your demand. A $0.04/unit price advantage evaporates fast when you must buy and discard 2,000 unused pieces.
Q: When is it better to redesign a BOM line to a lower‑MOQ alternate versus absorbing excess inventory?
A: Evaluate the total cost of ownership: the redesign effort, requalification testing, and EMS revalidation cost versus the scrap cost of the overbuy — including warehousing, obsolescence risk, and tied‑up cash. If the overbuy is on a high‑runner that you will certainly consume within 12 months, absorbing the inventory may be cheaper. For low‑run, niche designs where the MOQ overbuy recurs every build, switching to a multi‑sourced alternate with standard cut‑tape or lower‑reel quantities often pays back within the first production run.
Q: Can we negotiate MOQ reductions on sole‑source ICs that lock us into high minimums?
A: Yes. Ask for a partial reel in exchange for a small upcharge — typically 10–20%. Request that the distributor hold consignment stock against a forecast, or consolidate demand across programmes inside your company to reach a higher natural quantity break. Presenting a credible 12‑month forecast, even in writing, often shifts the conversation from a one‑shot MOQ to a supply agreement with periodic call‑offs. Distributors value visibility into future demand and will sometimes waive the MOQ entirely for strategic accounts.
Q: How do reel, tray, and tube packaging multiples affect BOM cost calculations?
A: Standard reel quantities — 3,000 pieces for 0402 passives, 4,000 for larger chip sizes, 1,000 or more for QFP trays — become the effective MOQ even if the line item is quoted at 500 pieces. The cost model must round the purchase quantity up to the next full packaging multiple, then amortise landed cost only over the usable volume after placement attrition and feeder scrap. A theoretical reel cost spread across 500 consumed parts yields a very different per‑unit number than the same reel cost spread across 2,800 consumed parts.
Q: What checks should procurement demand from engineering before going out for the first RFQ?
A: Request a fully costed BOM with current availability and packaging data. It should identify any single‑source or high‑MOQ lines, list alternative parts tagged as “safe,” “conditional,” or “last resort,” and note the design’s minimum acceptable volume tolerance. Without these inputs, the RFQ responses will conceal the MOQ gap that later shows up as purchase price variance. A clean, procurement‑aware BOM transforms the RFQ from a pricing exercise into a true negotiation baseline.
Q: How can we separate MOQ‑driven BOM cost drift from FX, attrition, and substitution variance?
A: Implement distinct variance categories in the costed‑versus‑purchased comparison: (1) purchase price variance — the difference between the baseline unit price and the actual paid price for the same part and quantity; (2) MOQ excess — the cost of inventory bought solely to meet a packaging or minimum‑order requirement; (3) substitute part uplift — the delta when a qualified alternate costs more; (4) BOM revision change — cost change driven by an ECO; (5) currency impact — FX movement between cost model and payment; (6) attrition/landed‑cost delta — scrap, freight adjustments, and duties not captured elsewhere. Tagging each variance line at PO booking makes it clear which driver consumed the margin and enables targeted corrective action rather than a blanket “cost overrun” narrative.